UNITED STATES
SECURITIES AND EXCHANGE COMMISSION
WASHINGTON, D.C. 20549
____________________________________
FORM 8-K
____________________________________
CURRENT REPORT
PURSUANT TO SECTION 13 OR 15(D)
OF THE SECURITIES EXCHANGE ACT OF 1934
Date of Report (Date of Earliest Event Reported): April 23, 2025
____________________________________
(Exact name of registrant as specified in its charter)
____________________________________
| (State or other jurisdiction of incorporation or organization) | |||||||||||
| (Commission File No.) | (I.R.S. Employer Identification No.) | ||||||||||
| (Zip code) | |||||||||||
| (Address of principal executive offices) | |||||||||||
(Registrant’s telephone number, including area code)
Not Applicable
(Former name or former address, if changed since last report)
____________________________________
Check the appropriate box below if the Form 8-K filing is intended to simultaneously satisfy the filing obligation of the registrant under any of the following provisions (see General Instruction A.2.):
| Written communications pursuant to Rule 425 under the Securities Act (17 CFR 230.425) | |||||
| Soliciting material pursuant to Rule 14a-12 under the Exchange Act (17 CFR 240.14a-12) | |||||
| Pre-commencement communications pursuant to Rule 14d-2(b) under the Exchange Act (17 CFR 240.14d-2(b)) | |||||
| Pre-commencement communications pursuant to Rule 13e-4(c) under the Exchange Act (17 CFR 240.13e-4(c)) | |||||
Securities registered pursuant to Section 12(b) of the Act:
Class | Trading Symbol(s) | Name of each exchange on which registered | ||||||
Indicate by check mark whether the registrant is an emerging growth company as defined in Rule 405 of the Securities Act of 1933 (§230.405 of this chapter) or Rule 12b-2 of the Securities Exchange Act of 1934 (§240.12b-2 of this chapter).
Emerging growth company ☐
If an emerging growth company, indicate by check mark if the registrant has elected not to use the extended transition period for complying with any new or revised financial accounting standards provided pursuant to Section 13(a) of the Exchange Act. ☐
| Item 2.02 | Results of Operations and Financial Condition | ||||
On April 23, 2025, Westinghouse Air Brake Technologies Corporation (the “Company”) issued a press release reporting, among other things, the Company’s 2025 first quarter results. A copy of this press release is attached as Exhibit 99.1 to this Current Report on Form 8-K and is incorporated into this Item 2.02 by reference. The Company is also furnishing an investor presentation relating to its first quarter of 2025 (the “Presentation”), which will be used by the management team for presentations to investors and others. A copy of the Presentation is attached hereto as Exhibit 99.2 and incorporated into this Item 2.02 by reference. The Presentation is also available on the Company’s website at www.wabteccorp.com.
In accordance with General Instruction B.2 of Form 8-K, the information furnished pursuant to this Item 2.02 in this Current Report on Form 8-K, including Exhibits 99.1 and 99.2, shall not be deemed “filed” for the purposes of Section 18 of the Securities Exchange Act of 1934, as amended, or otherwise subject to the liability of that section, nor shall it be deemed incorporated by reference in any filing under the Securities Act of 1933, as amended, except as shall be expressly set forth by specific reference in such a filing.
| Item 7.01. | Regulation FD Disclosure | ||||
On April 23, 2025, the Company issued a press release which, among other things, provided earnings guidance for fiscal year 2025. A copy of the press release is attached to this report as Exhibit 99.1 and the paragraph under the heading “2025 Financial Guidance” which discusses 2025 guidance is incorporated into this Item 7.01 by reference. The Company also furnished a Presentation relating to its first quarter of 2025, which is incorporated into this Item 7.01 by reference. A copy of the Presentation is attached to this report as Exhibit 99.2.
In accordance with General Instruction B.2 of Form 8-K, the information furnished pursuant to this Item 7.01 in this Current Report on Form 8-K, including Exhibits 99.1 and 99.2, shall not be deemed “filed” for the purposes of Section 18 of the Securities Exchange Act of 1934, as amended, or otherwise subject to the liability of that section, nor shall it be deemed incorporated by reference in any filing under the Securities Act of 1933, as amended, except as shall be expressly set forth by specific reference in such a filing.
| Item 9.01. | Financial Statements and Exhibits | ||||
(d) Exhibits.
The following exhibits are furnished with this report on Form 8-K:
| Exhibit No. | Description | ||||
| 99.1 | |||||
| 99.2 | |||||
| 104 | Cover Page Interactive Data File (embedded within the Inline XBRL document) | ||||
Caution Concerning Forward-Looking Statements
This communication contains “forward-looking” statements as that term is defined in Section 27A of the Securities Act of 1933, as amended, and Section 21E of the Securities Exchange Act of 1934, as amended by the Private Securities Litigation Reform Act of 1995. All statements, other than historical facts, including statements regarding Wabtec’s plans, objectives, expectations and intentions; Wabtec’s expectations about future sales, earnings and cash conversion; Wabtec’s projected expenses and cost savings associated with its Integration 2.0 and 3.0 initiatives and its portfolio optimization; Wabtec’s 5-year outlook; Wabtec’s expectations for evolving global industry, market and macro-economic conditions and their impact on Wabtec’s business; synergies and other expected benefits from Wabtec’s acquisitions; Wabtec’s expectations for production and demand conditions; and any assumptions underlying any of the foregoing, are forward looking statements. Forward-looking statements concern future circumstances and results and other statements that are not historical facts and are sometimes identified by the words “may,” “will,” “should,” “potential,” “intend,” “expect,” “endeavor,” “seek,” “anticipate,” “estimate,” “overestimate,” “underestimate,” “believe,” “could,” “project,” “predict,” “continue,” “target” or other similar words or expressions. Forward-looking statements are based upon current plans, estimates and expectations that are subject to risks, uncertainties and assumptions. Should one or more of these risks or uncertainties materialize, or should underlying assumptions prove incorrect, actual results may vary materially from those indicated or anticipated by such forward-looking statements. The inclusion of such statements should not be regarded as a representation that such plans, estimates or expectations will be achieved. Important factors that could cause actual results to differ materially from such plans, estimates or expectations include, among others, (1) changes in general economic and/or industry specific conditions, including the impacts of significant recent shifts in trade policies (including the imposition of tariffs and retaliatory tariff measures) as well as tax programs, inflation, supply chain disruptions, foreign currency exchange and industry consolidation and market reactions to these factors;
(2) changes in the financial condition or operating strategies of Wabtec's customers; (3) unexpected costs, charges or expenses resulting from acquisitions and potential failure to realize synergies and other anticipated benefits of acquisitions, including as a result of integrating acquired targets into Wabtec; (4) ability to retain and hire key personnel; (5) evolving legal, regulatory and tax regimes; (6) changes in the expected timing of projects; (7) a decrease in freight or passenger rail traffic; (8) an increase in manufacturing costs; (9) actions by third parties, including government agencies; (10) the impacts of epidemics, pandemics, or similar public health crises on the global economy and, in particular, our customers, suppliers and end-markets, (11) potential disruptions, instability, and volatility in global markets as a result of global military action, acts of terrorism or armed conflict, including Russia’s invasion of Ukraine; (12) cybersecurity and data protection risks and (13) other risk factors as detailed from time to time in Wabtec’s reports filed with the SEC, including Wabtec’s annual report on Form 10-K, periodic quarterly reports on Form 10-Q, current reports on Form 8-K and other documents filed with the SEC. The foregoing list of important factors is not exclusive. Any forward-looking statements speak only as of the date of this communication. Wabtec does not undertake any obligation to update any forward-looking statements, whether as a result of new information or development, future events or otherwise, except as required by law. Readers are cautioned not to place undue reliance on any of these forward-looking statements.
SIGNATURES
Pursuant to the requirements of Securities Exchange Act of 1934, the Company has duly caused this report to be signed on its behalf by the undersigned thereunto duly authorized.
| WESTINGHOUSE AIR BRAKE TECHNOLOGIES CORPORATION | |||||
| By: | /s/ JOHN A. OLIN | ||||
| John A. Olin | |||||
| Executive Vice President and Chief Financial Officer | |||||
| (Duly Authorized Officer and Principal Financial Officer) | |||||
| DATE: | |||||

Exhibit 99.1
Wabtec Reports First Quarter 2025 Results;
Announces Increase in Full-Year EPS Guidance
| 1Q 2025 | ||||||||
| SALES | GAAP DILUTED EARNINGS PER SHARE | ADJUSTED DILUTED EARNINGS PER SHARE | ||||||||||||
| $2.61B | $1.88 | $2.28 | ||||||
| +4.5% YOY | +22.9% YOY | +20.6% YOY | ||||||
Q1 2025 HIGHLIGHTS
| “The Wabtec team has started the year strong, delivering over 20% in earnings per share growth and highlighting the continued business momentum across both the Freight and Transit segments,” said Rafael Santana, Wabtec’s President and CEO. | ||
| “We are also pleased with the strong momentum of our international business as well as the geographic diversity that it brings to our company. International revenue has grown at a high single-digit rate over the past couple years, while delivering a higher level of profitability than our North America region. Underpinning our international growth is consistent expansion of our installed base of locomotives and transit car systems, which in turn has driven higher sales growth of our service, components and digital solutions. | ||
| “We are approaching the remainder of the year with caution but with the discipline and focus to take the necessary actions to deliver against our commitments in an uncertain and volatile economic landscape.” | ||
| Rafael Santana President and CEO | ||
•GAAP Diluted Earnings Per Share of $1.88, Up 22.9%; Adjusted Diluted Earnings Per Share of $2.28, Up 20.6%
•GAAP Operating Margin at 18.2%; Adjusted Operating Margin Up 1.9 pts to 21.7%
•Sales Growth of 4.5% to $2.61 billion
•Returned $141 million to Shareholders via Dividends and Share Repurchases
•Increasing Adjusted Diluted Earnings Per Share Mid-Point guidance by $0.10 per share while widening the range to $8.35 - $8.95 driven by economic uncertainty
PITTSBURGH, April 23, 2025 – Wabtec Corporation (NYSE: WAB) today reported first quarter 2025 GAAP earnings per diluted share of $1.88, up 22.9% versus the first quarter of 2024. Adjusted earnings per diluted share were $2.28, up 20.6% versus the same quarter a year ago. First quarter sales were $2.61 billion and cash from operations was $191 million.
2025 First Quarter Consolidated Results
| Wabtec Corporation Consolidated Financial Results | ||||||||||||||
| $ in millions except earnings per share and percentages; margin change in percentage points (pts) | First Quarter | |||||||||||||
| 2025 | 2024 | Change | ||||||||||||
| Net Sales | $2,610 | $2,497 | 4.5 | % | ||||||||||
| GAAP Gross Margin | 34.5 | % | 32.7 | % | 1.8 pts | |||||||||
| Adjusted Gross Margin | 34.6 | % | 32.9 | % | 1.7 pts | |||||||||
| GAAP Operating Margin | 18.2 | % | 16.5 | % | 1.7 pts | |||||||||
| Adjusted Operating Margin | 21.7 | % | 19.8 | % | 1.9 pts | |||||||||
| GAAP Diluted EPS | $1.88 | $1.53 | 22.9 | % | ||||||||||
| Adjusted Diluted EPS | $2.28 | $1.89 | 20.6 | % | ||||||||||
| Cash Flow from Operations | $191 | $334 | $(143) | |||||||||||
| Operating Cash Flow Conversion | 43 | % | 84 | % | ||||||||||
•Sales increased 4.5% compared to the year-ago quarter driven by higher sales in both the Freight and Transit segments.
•GAAP operating margin was higher than the prior year at 18.2%, and adjusted operating margin was higher than the prior year at 21.7%. Both GAAP and adjusted operating margins benefited from higher sales and improved gross margins.
•GAAP EPS and adjusted EPS increased from the year-ago quarter primarily due to higher sales and operating margin expansion.
2025 First Quarter Freight Segment Results
| Wabtec Corporation Freight Segment Financial Results | |||||||||||
| Net sales $ in millions; margin change in percentage points (pts) | First Quarter | ||||||||||
| 2025 | 2024 | Change | |||||||||
| Net Sales | $1,901 | $1,824 | 4.2 | % | |||||||
| GAAP Gross Margin | 36.0 | % | 34.3 | % | 1.7 pts | ||||||
| Adjusted Gross Margin | 36.2 | % | 34.5 | % | 1.7 pts | ||||||
| GAAP Operating Margin | 22.1 | % | 20.2 | % | 1.9 pts | ||||||
| Adjusted Operating Margin | 25.7 | % | 24.1 | % | 1.6 pts | ||||||
•Freight segment sales for the first quarter were up 4.2%, primarily driven by Services which was up 16.9%.
•GAAP operating margin and adjusted operating margin benefited from higher sales and improved gross margin.
2025 First Quarter Transit Segment Results
| Wabtec Corporation Transit Segment Financial Results | |||||||||||
| Net sales $ in millions; margin change in percentage points (pts) | First Quarter | ||||||||||
| 2025 | 2024 | Change | |||||||||
| Net Sales | $709 | $673 | 5.3 | % | |||||||
| GAAP Gross Margin | 30.3 | % | 28.2 | % | 2.1 pts | ||||||
| Adjusted Gross Margin | 30.4 | % | 28.6 | % | 1.8 pts | ||||||
| GAAP Operating Margin | 12.7 | % | 11.0 | % | 1.7 pts | ||||||
| Adjusted Operating Margin | 14.6 | % | 12.7 | % | 1.9 pts | ||||||
•Transit segment sales for the first quarter were up 5.3% driven by higher OE and aftermarket sales.
•GAAP and adjusted operating margins were up as a result of higher sales and improved gross margins.
Backlog
| Wabtec Corporation Consolidated Backlog Comparison | |||||||||||
| Backlog $ in millions | March 31, | ||||||||||
| 2025 | 2024 | Change | |||||||||
| 12-Month Backlog | $8,196 | $7,710 | 6.3 | % | |||||||
| Total Backlog | $22,302 | $22,083 | 1.0 | % | |||||||
The Company’s multi-year backlog continues to provide strong visibility. At March 31, 2025, the 12-month backlog was $486 million higher than the prior year period. At March 31, 2025, the multi-year backlog was $219 million higher than the prior year period, and excluding foreign currency exchange, the multi-year backlog was $460 million higher, up 2.1%.
Cash Flow and Liquidity Summary
•During the first quarter, cash provided by operations was $191 million versus $334 million in the year ago period due to higher accounts receivables.
•At the end of the quarter, the Company had cash, cash equivalents and restricted cash of $698 million and total debt of $4.01 billion. At March 31, 2025, the Company’s total available liquidity was $2.54 billion, which includes cash and cash equivalents plus $1.50 billion available under current credit facilities and $350 million borrowings available under our Revolving Receivables Program.
•During the quarter, the Company paid $43 million in dividends and repurchased $98 million of Wabtec shares.
2025 Financial Guidance
•Wabtec increased its 2025 adjusted EPS guidance by $0.10 at the mid-point and widened the range to $8.35 to $8.95 driven by economic volatility and uncertainty through the remainder of the year. Wabtec’s revenue guidance range remains unchanged at $10.725 billion to $11.025 billion.
•For full year 2025, Wabtec expects operating cash flow conversion of greater than 90 percent.

About Wabtec
Wabtec Corporation (NYSE: WAB) is revolutionizing the way the world moves for future generations. The company is a leading global provider of equipment, systems, digital solutions and value-added services for the freight and transit rail industries, as well as the mining, marine and industrial markets. Wabtec has been a leader in the rail industry for 155 years and has a vision to achieve a zero-emission rail system in the U.S. and worldwide. Visit Wabtec’s website at www.wabteccorp.com.
Forecasted GAAP Earnings Reconciliation
Wabtec is not presenting a quantitative reconciliation of our forecasted GAAP earnings per diluted share to forecasted adjusted earnings per diluted share in reliance on the unreasonable efforts exemption provided under Item 10(e)(1)(i)(B) of Regulation S-K. Wabtec is unable to predict with reasonable certainty and without unreasonable effort the impact and timing of restructuring-related and other charges, including acquisition-related expenses and the outcome of certain regulatory, legal and tax matters. The financial impact of these items is uncertain and is dependent on various factors, including timing, and could be material to our Consolidated Statements of Earnings.
Conference Call Information
Wabtec will host a call with analysts and investors at 8:30 a.m. ET, today. To listen via webcast, go to Wabtec’s website at www.WabtecCorp.com and click on “Events & Presentations” in the “Investor Relations” section. Also, an audio replay of the call will be available by calling 1-877-344-7529 or 1-412-317-0088 (access code: 1346315).
Information about non-GAAP Financial Information and Forward-Looking Statements
Wabtec’s earnings release and 2025 financial guidance mentions certain non-GAAP financial performance measures, including adjusted gross profit, adjusted operating expenses, adjusted operating margin, adjusted gross margin, EBITDA, adjusted EBITDA, adjusted income tax expense, adjusted income from operations, adjusted interest and other expense, adjusted net income, adjusted earnings per diluted share and operating cash flow conversion. Wabtec defines EBITDA as earnings before interest, taxes, depreciation and amortization. Adjusted EBITDA is further adjusted by restructuring costs. Wabtec defines operating cash flow conversion as net cash provided by operating activities divided by net income plus depreciation and amortization including deferred debt cost amortization. While Wabtec believes these are useful supplemental measures for investors, they are not presented in accordance with GAAP. Investors should not consider non-GAAP measures in isolation or as a substitute for net income, cash flows from operations, or any other items calculated in accordance with GAAP. In addition, the non-GAAP financial measures included in this release have inherent material limitations as performance measures because they add back certain expenses incurred by the Company to GAAP financial measures, resulting in those expenses not being taken into account in the applicable non-GAAP financial measure. Because not all companies use identical calculations, Wabtec’s presentation of non-GAAP financial measures may not be comparable to other similarly titled measures of other companies. Included in this release are reconciliation tables that provide details about how adjusted results relate to GAAP results.
This communication contains “forward-looking” statements as that term is defined in Section 27A of the Securities Act of 1933, as amended, and Section 21E of the Securities Exchange Act of 1934, as amended by the Private Securities Litigation Reform Act of 1995. All statements, other than historical facts, including statements regarding Wabtec’s plans, objectives, expectations and intentions; Wabtec’s expectations about future sales, earnings and cash conversion and statements regarding macro-economic conditions and evolving production and demand conditions; and any assumptions underlying any of the foregoing, are forward-looking statements. Forward-looking statements concern future circumstances and results and other statements that are not historical facts and are sometimes identified by the words “may,” “will,” “should,” “potential,” “intend,” “expect,” “endeavor,” “seek,” “anticipate,” “estimate,” “overestimate,” “underestimate,” “believe,” “could,” “project,” “predict,” “continue,” “target” or other similar words or expressions. Forward-looking statements are based upon current plans, estimates and expectations that are subject to risks, uncertainties and assumptions. Should one or more of these risks or uncertainties materialize, or should underlying assumptions prove incorrect, actual results may vary materially from those indicated or anticipated by such forward-looking statements. The inclusion of such statements should not be regarded as a representation that such plans, estimates or expectations will be achieved. Important factors that could cause actual results to differ materially from such plans, estimates or expectations include, among others, (1) changes in general economic and/or industry specific conditions, including the impacts of significant recent shifts in trade policies (including the imposition of tariffs and retaliatory tariff measures) as well as tax programs, inflation, supply chain disruptions, foreign currency exchange and industry consolidation and market reactions to these factors; (2) changes in the financial condition or operating strategies of Wabtec’s customers; (3) unexpected costs, charges or expenses resulting from acquisitions and potential failure to realize synergies and other anticipated benefits of acquisitions, including as a result of integrating acquired targets into Wabtec; (4) inability to retain and hire key personnel; (5) evolving legal, regulatory and tax regimes; (6) changes in the expected timing of projects; (7) a decrease in freight or passenger rail traffic; (8) an increase in manufacturing costs; (9) actions by third parties, including government agencies; (10) the impacts of epidemics, pandemics, or similar public health crises on the global economy and, in particular, our customers, suppliers and end-markets, (11) potential disruptions, instability, and volatility in global markets as a result of global military action, acts of terrorism or armed conflict, including from the imposition of economic sanctions on Russia resulting from the invasion of Ukraine; (12) cybersecurity and data protection risks and (13) other risk factors as detailed from time to time in Wabtec’s reports filed with the SEC, including Wabtec’s annual report on Form 10-K, periodic quarterly reports on Form 10-Q, current reports on Form 8-K and other documents filed with the SEC. The foregoing list of important factors is not exclusive. Any forward-looking statements speak only as of the date of this communication. Wabtec does not undertake any obligation to update any forward-looking statements, whether as a result of new information or development, future events or otherwise, except as required by law. Readers are cautioned not to place undue reliance on any of these forward-looking statements.
Wabtec Investor Contact
Kyra Yates / Kyra.Yates@wabtec.com / 817-349-2735
Wabtec Media Contact
Tim Bader / Tim.Bader@wabtec.com / 682-319-7925
| Appendix A | ||||||||
WESTINGHOUSE AIR BRAKE TECHNOLOGIES CORPORATION
CONDENSED CONSOLIDATED STATEMENTS OF INCOME
FOR THE THREE MONTHS ENDED MARCH 31, 2025 AND 2024
(AMOUNTS IN MILLIONS EXCEPT PER SHARE DATA)
(UNAUDITED)
| Three Months Ended March 31, | ||||||||||||||
| 2025 | 2024 | |||||||||||||
| Net sales | $ | 2,610 | $ | 2,497 | ||||||||||
| Cost of sales | (1,710) | (1,682) | ||||||||||||
| Gross profit | 900 | 815 | ||||||||||||
| Gross profit as a % of Net sales | 34.5 | % | 32.7 | % | ||||||||||
| Selling, general and administrative expenses | (307) | (281) | ||||||||||||
| Engineering expenses | (46) | (48) | ||||||||||||
| Amortization expense | (73) | (74) | ||||||||||||
| Total operating expenses | (426) | (403) | ||||||||||||
| Operating expenses as a % of Net sales | 16.3 | % | 16.2 | % | ||||||||||
| Income from operations | 474 | 412 | ||||||||||||
| Income from operations as a % of Net sales | 18.2 | % | 16.5 | % | ||||||||||
| Interest expense, net | (46) | (47) | ||||||||||||
| Other expense, net | (2) | (2) | ||||||||||||
| Income before income taxes | 426 | 363 | ||||||||||||
| Income tax expense | (99) | (86) | ||||||||||||
| Effective tax rate | 23.2 | % | 23.6 | % | ||||||||||
| Net income | 327 | 277 | ||||||||||||
| Less: Net income attributable to noncontrolling interest | (5) | (5) | ||||||||||||
| Net income attributable to Wabtec shareholders | $ | 322 | $ | 272 | ||||||||||
| Earnings Per Common Share | ||||||||||||||
| Basic | ||||||||||||||
| Net income attributable to Wabtec shareholders | $ | 1.88 | $ | 1.54 | ||||||||||
| Diluted | ||||||||||||||
| Net income attributable to Wabtec shareholders | $ | 1.88 | $ | 1.53 | ||||||||||
| Weighted average shares outstanding | ||||||||||||||
| Basic | 170.5 | 176.5 | ||||||||||||
| Diluted | 171.3 | 177.2 | ||||||||||||
| Appendix A | ||||||||
WESTINGHOUSE AIR BRAKE TECHNOLOGIES CORPORATION
CONDENSED CONSOLIDATED STATEMENTS OF INCOME (CONTINUED)
FOR THE THREE MONTHS ENDED MARCH 31, 2025 AND 2024
(AMOUNTS IN MILLIONS EXCEPT PER SHARE DATA)
(UNAUDITED)
| Three Months Ended March 31, | |||||||||||||||||
| 2025 | 2024 | ||||||||||||||||
| Segment Information | |||||||||||||||||
| Freight Net sales | $ | 1,901 | $ | 1,824 | |||||||||||||
| Freight Income from operations | $ | 420 | $ | 368 | |||||||||||||
| Freight Operating margin | 22.1 | % | 20.2 | % | |||||||||||||
| Transit Net sales | $ | 709 | $ | 673 | |||||||||||||
| Transit Income from operations | $ | 90 | $ | 74 | |||||||||||||
| Transit Operating margin | 12.7 | % | 11.0 | % | |||||||||||||
| Backlog Information (Note: 12-month is a sub-set of total) | March 31, 2025 | December 31, 2024 | March 31, 2024 | ||||||||||||||
| Freight Total | $ | 17,851 | $ | 17,986 | $ | 17,898 | |||||||||||
| Transit Total | 4,451 | 4,286 | 4,185 | ||||||||||||||
| Wabtec Total | $ | 22,302 | $ | 22,272 | $ | 22,083 | |||||||||||
| Freight 12-month | $ | 6,069 | $ | 5,577 | $ | 5,667 | |||||||||||
| Transit 12-month | 2,127 | 2,104 | 2,043 | ||||||||||||||
| Wabtec 12-month | $ | 8,196 | $ | 7,681 | $ | 7,710 | |||||||||||
| Appendix B | ||||||||
WESTINGHOUSE AIR BRAKE TECHNOLOGIES CORPORATION
CONDENSED CONSOLIDATED BALANCE SHEETS
(UNAUDITED)
| March 31, 2025 | December 31, 2024 | ||||||||||
| In millions | |||||||||||
| Cash, cash equivalents and restricted cash | $ | 698 | $ | 715 | |||||||
| Receivables, net | 1,932 | 1,702 | |||||||||
| Inventories, net | 2,378 | 2,314 | |||||||||
| Other current assets | 247 | 212 | |||||||||
| Total current assets | 5,255 | 4,943 | |||||||||
| Property, plant and equipment, net | 1,462 | 1,447 | |||||||||
| Goodwill | 8,787 | 8,710 | |||||||||
| Other intangible assets, net | 2,892 | 2,934 | |||||||||
| Other noncurrent assets | 700 | 668 | |||||||||
| Total Assets | $ | 19,096 | $ | 18,702 | |||||||
| Current liabilities | $ | 3,927 | $ | 3,792 | |||||||
| Long-term debt | 3,503 | 3,480 | |||||||||
| Other long-term liabilities | 1,252 | 1,297 | |||||||||
| Total Liabilities | 8,682 | 8,569 | |||||||||
| Shareholders' equity | 10,368 | 10,091 | |||||||||
| Noncontrolling interest | 46 | 42 | |||||||||
| Total Equity | 10,414 | 10,133 | |||||||||
| Total Liabilities and Equity | $ | 19,096 | $ | 18,702 | |||||||
| Appendix C | ||||||||
WESTINGHOUSE AIR BRAKE TECHNOLOGIES CORPORATION
CONDENSED CONSOLIDATED STATEMENTS OF CASH FLOWS
(UNAUDITED)
| Three Months Ended March 31, | |||||||||||
| 2025 | 2024 | ||||||||||
| In millions | |||||||||||
| Operating activities | |||||||||||
| Net income | $ | 327 | $ | 277 | |||||||
| Non-cash expense | 127 | 126 | |||||||||
| Receivables | (226) | 121 | |||||||||
| Inventories | (29) | (85) | |||||||||
| Accounts payable | 13 | 45 | |||||||||
| Other assets and liabilities | (21) | (150) | |||||||||
| Net cash provided by operating activities | 191 | 334 | |||||||||
| Net cash used for investing activities | (44) | (19) | |||||||||
| Net cash used for financing activities | (172) | (289) | |||||||||
| Effect of changes in currency exchange rates | 8 | (7) | |||||||||
| (Decrease) increase in cash | (17) | 19 | |||||||||
| Cash, cash equivalents and restricted cash, beginning of period | 715 | 620 | |||||||||
| Cash, cash equivalents and restricted cash, end of period | $ | 698 | $ | 639 | |||||||
| Appendix D | ||||||||
Set forth below is the calculation of the non-GAAP performance measures included in this press release. We believe that these measures provide useful supplemental information to assess our operating performance and to evaluate period-to-period comparisons. Non-GAAP financial measures should be viewed in addition to, and not as an alternative for, Wabtec’s reported results prepared in accordance with GAAP.
| Wabtec Corporation | |||||||||||||||||||||||||||||||||||||||||||||||||||||||||||||||||
| Reconciliation of Reported Results to Adjusted Results | |||||||||||||||||||||||||||||||||||||||||||||||||||||||||||||||||
| (in millions) | First Quarter 2025 Actual Results | ||||||||||||||||||||||||||||||||||||||||||||||||||||||||||||||||
| Net | Gross | Operating | Income from | Interest & | Net | Noncontrolling | Wabtec | ||||||||||||||||||||||||||||||||||||||||||||||||||||||||||
| Sales | Profit | Expenses | Operations | Other Exp | Tax | Income | Interest | Net Income | EPS | ||||||||||||||||||||||||||||||||||||||||||||||||||||||||
| Reported Results | $ | 2,610 | $ | 900 | $ | (426) | $ | 474 | $ | (48) | $ | (99) | $ | 327 | $ | (5) | $ | 322 | $ | 1.88 | |||||||||||||||||||||||||||||||||||||||||||||
| Restructuring and Portfolio Optimization costs | — | 3 | 6 | 9 | — | (2) | 7 | — | 7 | $ | 0.04 | ||||||||||||||||||||||||||||||||||||||||||||||||||||||
| Transaction costs | — | — | 10 | 10 | — | (2) | 8 | — | 8 | $ | 0.04 | ||||||||||||||||||||||||||||||||||||||||||||||||||||||
| Non-cash Amortization expense | — | — | 72 | 72 | — | (17) | 55 | — | 55 | $ | 0.32 | ||||||||||||||||||||||||||||||||||||||||||||||||||||||
| Adjusted Results | $ | 2,610 | $ | 903 | $ | (338) | $ | 565 | $ | (48) | $ | (120) | $ | 397 | $ | (5) | $ | 392 | $ | 2.28 | |||||||||||||||||||||||||||||||||||||||||||||
| Fully Diluted Shares Outstanding | 171.3 | ||||||||||||||||||||||||||||||||||||||||||||||||||||||||||||||||
| Wabtec Corporation | |||||||||||||||||||||||||||||||||||||||||||||||||||||||||||||||||
| Reconciliation of Reported Results to Adjusted Results | |||||||||||||||||||||||||||||||||||||||||||||||||||||||||||||||||
| (in millions) | First Quarter 2024 Actual Results | ||||||||||||||||||||||||||||||||||||||||||||||||||||||||||||||||
| Net | Gross | Operating | Income from | Interest & | Net | Noncontrolling | Wabtec | ||||||||||||||||||||||||||||||||||||||||||||||||||||||||||
| Sales | Profit | Expenses | Operations | Other Exp | Tax | Income | Interest | Net Income | EPS | ||||||||||||||||||||||||||||||||||||||||||||||||||||||||
| Reported Results | $ | 2,497 | $ | 815 | $ | (403) | $ | 412 | $ | (49) | $ | (86) | $ | 277 | $ | (5) | $ | 272 | $ | 1.53 | |||||||||||||||||||||||||||||||||||||||||||||
| Restructuring and Portfolio Optimization costs | — | 6 | 4 | 10 | — | (2) | 8 | — | 8 | $ | 0.05 | ||||||||||||||||||||||||||||||||||||||||||||||||||||||
| Non-cash Amortization expense | — | — | 73 | 73 | — | (17) | 56 | — | 56 | $ | 0.31 | ||||||||||||||||||||||||||||||||||||||||||||||||||||||
| Adjusted Results | $ | 2,497 | $ | 821 | $ | (326) | $ | 495 | $ | (49) | $ | (105) | $ | 341 | $ | (5) | $ | 336 | $ | 1.89 | |||||||||||||||||||||||||||||||||||||||||||||
| Fully Diluted Shares Outstanding | 177.2 | ||||||||||||||||||||||||||||||||||||||||||||||||||||||||||||||||
| Appendix D | ||||||||
Set forth below is the calculation of the non-GAAP performance measures included in this press release. We believe that these measures provide useful supplemental information to assess our operating performance and to evaluate period-to-period comparisons. Non-GAAP financial measures should be viewed in addition to, and not as an alternative for, Wabtec’s reported results prepared in accordance with GAAP.
| Wabtec Corporation | |||||||||||||||||||||||||||||||||||||||||||||||||||||||||||||||||
| Reconciliation of Reported Results to Adjusted Results | |||||||||||||||||||||||||||||||||||||||||||||||||||||||||||||||||
| (in millions) | Fourth Quarter Year-to-Date 2024 Actual Results | ||||||||||||||||||||||||||||||||||||||||||||||||||||||||||||||||
| Net | Gross | Operating | Income from | Interest & | Net | Noncontrolling | Wabtec | ||||||||||||||||||||||||||||||||||||||||||||||||||||||||||
| Sales | Profit | Expenses | Operations | Other Exp | Tax | Income | Interest | Net Income | EPS | ||||||||||||||||||||||||||||||||||||||||||||||||||||||||
| Reported Results | $ | 10,387 | $ | 3,366 | $ | (1,757) | $ | 1,609 | $ | (199) | $ | (343) | $ | 1,067 | $ | (11) | $ | 1,056 | $ | 6.04 | |||||||||||||||||||||||||||||||||||||||||||||
| Restructuring and Portfolio Optimization costs | — | 37 | 33 | 70 | (4) | (16) | 50 | — | 50 | $ | 0.28 | ||||||||||||||||||||||||||||||||||||||||||||||||||||||
| Non-cash Amortization expense | — | — | 288 | 288 | — | (70) | 218 | — | 218 | $ | 1.24 | ||||||||||||||||||||||||||||||||||||||||||||||||||||||
| Adjusted Results | $ | 10,387 | $ | 3,403 | $ | (1,436) | $ | 1,967 | $ | (203) | $ | (429) | $ | 1,335 | $ | (11) | $ | 1,324 | $ | 7.56 | |||||||||||||||||||||||||||||||||||||||||||||
| Fully Diluted Shares Outstanding | 174.8 | ||||||||||||||||||||||||||||||||||||||||||||||||||||||||||||||||
| Wabtec Corporation | |||||||||||||||||||||||||||||||||||||||||||||||||||||||||||||||||
| Reconciliation of Reported Results to Adjusted Results | |||||||||||||||||||||||||||||||||||||||||||||||||||||||||||||||||
| (in millions) | Fourth Quarter Year-to-Date 2023 Actual Results | ||||||||||||||||||||||||||||||||||||||||||||||||||||||||||||||||
| Net | Gross | Operating | Income from | Interest & | Net | Noncontrolling | Wabtec | ||||||||||||||||||||||||||||||||||||||||||||||||||||||||||
| Sales | Profit | Expenses | Operations | Other Exp | Tax | Income | Interest | Net Income | EPS | ||||||||||||||||||||||||||||||||||||||||||||||||||||||||
| Reported Results | $ | 9,677 | $ | 2,944 | $ | (1,678) | $ | 1,266 | $ | (174) | $ | (267) | $ | 825 | $ | (10) | $ | 815 | $ | 4.53 | |||||||||||||||||||||||||||||||||||||||||||||
| Restructuring and Portfolio Optimization costs | — | 38 | 41 | 79 | — | (17) | 62 | — | 62 | $ | 0.34 | ||||||||||||||||||||||||||||||||||||||||||||||||||||||
| Gain on LKZ investment | — | — | — | — | (35) | — | (35) | — | (35) | $ | (0.19) | ||||||||||||||||||||||||||||||||||||||||||||||||||||||
| Non-cash Amortization expense | — | — | 298 | 298 | — | (74) | 224 | — | 224 | $ | 1.24 | ||||||||||||||||||||||||||||||||||||||||||||||||||||||
| Adjusted Results | $ | 9,677 | $ | 2,982 | $ | (1,339) | $ | 1,643 | $ | (209) | $ | (358) | $ | 1,076 | $ | (10) | $ | 1,066 | $ | 5.92 | |||||||||||||||||||||||||||||||||||||||||||||
| Fully Diluted Shares Outstanding | 179.5 | ||||||||||||||||||||||||||||||||||||||||||||||||||||||||||||||||
Appendix E
Set forth below is the calculation of the non-GAAP performance measures included in this press release. We believe that these measures provide useful supplemental information to assess our operating performance and to evaluate period-to-period comparisons. Non-GAAP financial measures should be viewed in addition to, and not as an alternative for, Wabtec’s reported results prepared in accordance with GAAP.
| Wabtec Corporation | |||||||||||||||||||||||||||||||||||||||||
First Quarter 2025 EBITDA Reconciliation | |||||||||||||||||||||||||||||||||||||||||
| (in millions) | |||||||||||||||||||||||||||||||||||||||||
| Reported Income | + | Other Income | + | Depreciation & | = | EBITDA | + | Restructuring & | = | Adjusted | |||||||||||||||||||||||||||||||
| from Operations | (Expense) | Amortization | Transaction Costs | EBITDA | |||||||||||||||||||||||||||||||||||||
| Consolidated Results | $ | 474 | $ | (2) | $ | 119 | $ | 591 | $ | 17 | $ | 608 | |||||||||||||||||||||||||||||
| Wabtec Corporation | |||||||||||||||||||||||||||||||||||||||||
First Quarter 2024 EBITDA Reconciliation | |||||||||||||||||||||||||||||||||||||||||
| (in millions) | |||||||||||||||||||||||||||||||||||||||||
| Reported Income | + | Other Income | + | Depreciation & | = | EBITDA | + | Restructuring | = | Adjusted | |||||||||||||||||||||||||||||||
| from Operations | (Expense) | Amortization | Costs | EBITDA | |||||||||||||||||||||||||||||||||||||
| Consolidated Results | $ | 412 | $ | (2) | $ | 122 | $ | 532 | $ | 8 | $ | 540 | |||||||||||||||||||||||||||||
Appendix F
WESTINGHOUSE AIR BRAKE TECHNOLOGIES CORPORATION
SALES BY PRODUCT LINE
(UNAUDITED)
| Three Months Ended March 31, | |||||||||||
| In millions | 2025 | 2024 | |||||||||
| Freight Segment | |||||||||||
| Services | $ | 863 | $ | 738 | |||||||
| Equipment | 476 | 526 | |||||||||
| Components | 381 | 384 | |||||||||
| Digital Intelligence | 181 | 176 | |||||||||
| Total Freight Segment | $ | 1,901 | $ | 1,824 | |||||||
| Transit Segment | |||||||||||
| Original Equipment Manufacturer | $ | 322 | $ | 310 | |||||||
| Aftermarket | 387 | 363 | |||||||||
| Total Transit Segment | $ | 709 | $ | 673 | |||||||
Appendix G
WESTINGHOUSE AIR BRAKE TECHNOLOGIES CORPORATION
RECONCILIATION OF REPORTED RESULTS TO ADJUSTED RESULTS - BY SEGMENT
(UNAUDITED)
| Three Months Ended March 31, | |||||||||||||||||||||||
| 2025 | 2024 | ||||||||||||||||||||||
| In millions | Gross Profit | Income from Operations | Gross Profit | Income from Operations | |||||||||||||||||||
| Freight Segment Reported Results | $ | 685 | $ | 420 | $ | 625 | $ | 368 | |||||||||||||||
| Freight Segment Reported Margin | 36.0 | % | 22.1 | % | 34.3 | % | 20.2 | % | |||||||||||||||
| Restructuring and Portfolio Optimization costs | 2 | 3 | 3 | 3 | |||||||||||||||||||
| Non-cash Amortization expense | — | 65 | — | 68 | |||||||||||||||||||
| Freight Segment Adjusted Results | $ | 687 | $ | 488 | $ | 628 | $ | 439 | |||||||||||||||
| Freight Segment Adjusted Margin | 36.2 | % | 25.7 | % | 34.5 | % | 24.1 | % | |||||||||||||||
| Transit Segment Reported Results | $ | 215 | $ | 90 | $ | 190 | $ | 74 | |||||||||||||||
| Transit Segment Reported Margin | 30.3 | % | 12.7 | % | 28.2 | % | 11.0 | % | |||||||||||||||
| Restructuring and Portfolio Optimization costs | 1 | 6 | 3 | 7 | |||||||||||||||||||
| Non-cash Amortization expense | — | 7 | — | 5 | |||||||||||||||||||
| Transit Segment Adjusted Results | $ | 216 | $ | 103 | $ | 193 | $ | 86 | |||||||||||||||
| Transit Segment Adjusted Margin | 30.4 | % | 14.6 | % | 28.6 | % | 12.7 | % | |||||||||||||||
Appendix H
WESTINGHOUSE AIR BRAKE TECHNOLOGIES CORPORATION
RECONCILIATION OF CHANGES IN NET SALES - BY SEGMENT
(UNAUDITED)
| Three Months Ended March 31, | ||||||||||||||||||||
| In millions | Freight | Transit | Consolidated | |||||||||||||||||
2024 Net sales | $ | 1,824 | $ | 673 | $ | 2,497 | ||||||||||||||
| Acquisitions | 15 | 8 | 23 | |||||||||||||||||
| Foreign Exchange | (26) | (17) | (43) | |||||||||||||||||
| Organic | 88 | 45 | 133 | |||||||||||||||||
2025 Net sales | $ | 1,901 | $ | 709 | $ | 2,610 | ||||||||||||||
| Change ($) | 77 | 36 | 113 | |||||||||||||||||
| Change (%) | 4.2 | % | 5.3 | % | 4.5 | % | ||||||||||||||
Appendix I
Set forth below is the calculation of the non-GAAP performance measures included in this press release. We believe that these measures provide useful supplemental information to assess our operating performance and to evaluate period-to-period comparisons. Non-GAAP financial measures should be viewed in addition to, and not as an alternative for, Wabtec's reported results prepared in accordance with GAAP.
| Wabtec Corporation | |||||||||||||||||||||||||||||
2025 First Quarter Cash Conversion Calculation | |||||||||||||||||||||||||||||
| (in millions) | |||||||||||||||||||||||||||||
| Reported Cash from Operations | ÷ | (Net Income | + | Depreciation & Amortization) | = | Cash Conversion | |||||||||||||||||||||||
| Consolidated Results | $191 | $327 | $120 | 43% | |||||||||||||||||||||||||
| Wabtec Corporation | |||||||||||||||||||||||||||||
2024 First Quarter Cash Conversion Calculation | |||||||||||||||||||||||||||||
| (in millions) | |||||||||||||||||||||||||||||
| Reported Cash from Operations | ÷ | (Net Income | + | Depreciation & Amortization) | = | Cash Conversion | |||||||||||||||||||||||
| Consolidated Results | $334 | $277 | $123 | 84% | |||||||||||||||||||||||||

1 Wabtec Financial Results & Company Highlights FIRST QUARTER 2025

2 This communication contains “forward-looking” statements as that term is defined in Section 27A of the Securities Act of 1933, as amended, and Section 21E of the Securities Exchange Act of 1934, as amended by the Private Securities Litigation Reform Act of 1995. All statements, other than historical facts, including statements regarding Wabtec’s plans, objectives, expectations and intentions; Wabtec’s expectations about future sales, earnings and cash conversion; Wabtec’s projected expenses and cost savings associated with its Integration 2.0 and 3.0 initiatives and its portfolio optimization; Wabtec’s 5-year outlook; Wabtec’s expectations for evolving global industry, market and macro-economic conditions and their impact on Wabtec’s business; synergies and other expected benefits from Wabtec’s acquisitions; Wabtec’s expectations for production and demand conditions; and any assumptions underlying any of the foregoing, are forward looking statements. Forward-looking statements concern future circumstances and results and other statements that are not historical facts and are sometimes identified by the words “may,” “will,” “should,” “potential,” “intend,” “expect,” “endeavor,” “seek,” “anticipate,” “estimate,” “overestimate,” “underestimate,” “believe,” “could,” “project,” “predict,” “continue,” “target” or other similar words or expressions. Forward-looking statements are based upon current plans, estimates and expectations that are subject to risks, uncertainties and assumptions. Should one or more of these risks or uncertainties materialize, or should underlying assumptions prove incorrect, actual results may vary materially from those indicated or anticipated by such forward-looking statements. The inclusion of such statements should not be regarded as a representation that such plans, estimates or expectations will be achieved. Important factors that could cause actual results to differ materially from such plans, estimates or expectations include, among others, (1) changes in general economic and/or industry specific conditions, including the impacts of significant recent shifts in trade policies (including the imposition of tariffs and retaliatory tariff measures) as well as tax programs, inflation, supply chain disruptions, foreign currency exchange and industry consolidation and market reactions to these factors; (2) changes in the financial condition or operating strategies of Wabtec's customers; (3) unexpected costs, charges or expenses resulting from acquisitions and potential failure to realize synergies and other anticipated benefits of acquisitions, including as a result of integrating acquired targets into Wabtec; (4) ability to retain and hire key personnel; (5) evolving legal, regulatory and tax regimes; (6) changes in the expected timing of projects; (7) a decrease in freight or passenger rail traffic; (8) an increase in manufacturing costs; (9) actions by third parties, including government agencies; (10) the impacts of epidemics, pandemics, or similar public health crises on the global economy and, in particular, our customers, suppliers and end- markets, (11) potential disruptions, instability, and volatility in global markets as a result of global military action, acts of terrorism or armed conflict, including Russia’s invasion of Ukraine; (12) cybersecurity and data protection risks and (13) other risk factors as detailed from time to time in Wabtec’s reports filed with the SEC, including Wabtec’s annual report on Form 10-K, periodic quarterly reports on Form 10-Q, current reports on Form 8-K and other documents filed with the SEC. The foregoing list of important factors is not exclusive. Any forward-looking statements speak only as of the date of this communication. Wabtec does not undertake any obligation to update any forward-looking statements, whether as a result of new information or development, future events or otherwise, except as required by law. Readers are cautioned not to place undue reliance on any of these forward-looking statements. This presentation as well as Wabtec’s earnings release and financial guidance mention certain non-GAAP financial performance measures, including adjusted gross profit, adjusted operating expenses, adjusted income from operations, adjusted interest and other expense, adjusted net income, adjusted operating margin, adjusted gross margin, adjusted income tax expense, adjusted earnings per diluted share, EBITDA and adjusted EBITDA, net debt and operating cash flow conversion rate. Wabtec defines EBITDA as earnings before interest, taxes, depreciation and amortization. Adjusted EBITDA is further adjusted for restructuring costs. Wabtec defines operating cash flow conversion as net cash provided by operating activities divided by net income plus depreciation and amortization including deferred debt cost amortization. While Wabtec believes these are useful supplemental measures for investors, they are not presented in accordance with GAAP. Investors should not consider non-GAAP measures in isolation or as a substitute for net income, cash flows from operations, or any other items calculated in accordance with GAAP. In addition, the non-GAAP financial measures included in this presentation have inherent material limitations as performance measures because they add back certain expenses incurred by the Company to GAAP financial measures, resulting in those expenses not being taken into account in the applicable non-GAAP financial measure. Because not all companies use identical calculations, Wabtec’s presentation of non-GAAP financial measures may not be comparable to other similarly titled measures of other companies. Included in this presentation are reconciliation tables that provide details about how adjusted results relate to GAAP results. Wabtec is not presenting a quantitative reconciliation of its forecasted GAAP earnings per diluted share to forecasted adjusted earnings per diluted share as it is unable to predict with reasonable certainty and without unreasonable effort the impact and timing of restructuring- related and other charges, including acquisition-related expenses and the outcome of certain regulatory, legal and tax matters; the financial impact of these items is uncertain and is dependent on various factors, including the timing, and could be material to Wabtec’s Consolidated Statement of Earnings. Forward Looking Statements & Non-GAAP Financial Information

Today’s Participants JOHN OLIN Executive Vice President & Chief Financial Officer RAFAEL SANTANA President & Chief Executive Officer KYRA YATES Vice President, Investor Relations 3

1Q 2025 Overview Up 4.5% YOY$2.61BSales 21.7% Adjusted 18.2% GAAP Operating Margin $1.88 GAAP Earnings Per Share $191M Cash Flow from Operations(1) $8.20B12-Month Backlog ST RO NG EXEC UT ION AN D CO N T INUI NG BU S I N ES S MO MEN T UM Note: Adjusted numbers represent non-GAAP financial measures. See Appendix for additional details and reconciliations (1) The favorable impact from payments of accounts receivable securitization was $0 in the 1st quarter of 2025 and $210 million in the prior year period. Increased sales driven by growth in Freight and Transit segments Operating margin benefits from sales growth, improved gross margin and proactive cost controls GAAP EPS up 22.9% YoY … Adjusted EPS up 20.6% YoY Operating cash flow driven by higher net income … tempered by higher accounts receivables Backlog continues to provide visibility for 2025 … 12-month backlog up 6.3% $2.28 Adjusted 4

2025 Market Expectations 5 NORTH AMERICAN FREIGHT TRAFFIC F R E I G H T +NA Traffic Active Locomotive Fleet + International Freight Volumes -NA Railcar Deliveries Mining Commodities T R A N S I T +Infrastructure Investment /+Global Ridership FAVORABLE / UNFAVORABLE NORTH AMERICAN AVERAGE ACTIVE LOCOMOTIVES NORTH AMERICAN RAILCAR DELIVERIES INTERNATIONAL FREIGHT VOLUMES Sources: Previous 3 months available for Brazil, China, India Ministry of Railways, South Africa, Kazakhstan, Source: Association of American Railroads Source: Wabtec Source: Rail Supply Institute and FTR Associates 2.1% 2.5% 2.3% 3.0% 2Q24 3Q24 4Q24 1Q25 1Q22 1Q23 1Q24 1Q25 4 9 K H I S T O R I C A L 1 0 - Y E A R A V E R A G E -8.8% 2.1% 0.2% 2.6% 14.9% Brazil China India South Africa Kazakhstan2021 2022 2023 2024 2025F 30K 41K 45K 42K 35K

Executing On Our Value Creation Framework VA L U E C R E AT I O N F R A M E W O R K R E C E N T W I N S Signed $300 million service agreement in Kazakhstan $140 million new locomotive order with N. A. Class 1 New locomotive, mining & service orders in APAC region totaling $130 million Won two multi-year Transit Platform Door contracts valued at $85 million for Metro Madrid and Hamburg Secured $50 million order to provide Brakes and Couplers for servicing NYCTA Accelerate innovation of scalable technologies Grow and refresh expansive global installed base Drive fuel efficiencies thru emerging technologies Expand high-margin recurring revenue streams Drive continuous operational improvement 6

International Revenue Growth(1) INTERNATIONAL MOMENTUM WITH A HIGHER PROFIT MARGIN THAN NORTH AMERICA R E G I O N A L R E V E N U E 2022 2023 2024 Europe/MENA 2022 2023 2024 2022 2023 2024 2022 2023 2024 2022 2023 2024 South America SSA CIS APAC/India R E S I L I E N T G R O W T H I N T H E I N T E R N A T I O N A L I N S T A L L E D B A S E 2017 2018 2019 2020 2021 2022 2023 20242022 2023 2024 I N T E R N A T I O N A L R E V E N U E G R O W T H I N T E R N A T I O N A L R E V E N U E 2024 by Business 2024 by Region Digital Transit Equipment Services Components 23% 51% 13% 8% 5% 42% 33% 12% 10%3% Europe / MENA APAC / India CIS South America SSA 7 (1) International excludes North America

2 0 2 4 GAAP 2 0 2 5 GAAP 2 0 2 4 ADJ(1) 2 0 2 5 ADJ(1) OP INCOME / OP MARGIN $412M 16.5% 18.2% $495M 19.8% $565M 21.7%$474M 8 1Q 2025 Financial Summary SALES EARNINGS PER SHARE (1) Adjusted numbers represent non-GAAP financial measures. See Appendix for additional details and reconciliations I NC REAS ED S A LE S, O P ERATI NG MARG IN AN D E P S G ROWTH 4.5% INCREASE (6.2% INCREASE EX-CURRENCY) 2 0 2 4 2 0 2 5 2 0 2 4 GAAP 2 0 2 5 GAAP 2 0 2 4 ADJ(1) 2 0 2 5 ADJ(1) $2.61B$2.50B $1.53 $1.88 $1.89 $2.28 +22.9% YOY +20.6% YOY

1Q 2025 Sales ($ in millions) Y O Y1 Q ’ 2 5P R O D U C T L I N E 16.9%$863Services(1) (9.5)%$476Equipment (0.8)%$381Components(1) 2.8%$181Digital Intelligence 4.2%$1,901Freight Segment 5.3%$709Transit Segment 4 . 5 %$ 2 , 6 1 0T O T A L S A L E S 1 Q K E Y D R I V E R S S E R V I C E S Increased sales from higher modernization deliveries and overhauls E Q U I P M E N T Lower locomotive deliveries as planned C O M P O N E N T S Portfolio optimization and lower North America rail car build, partially offset by growth in industrial products D I G I T A L I N T E L L I G E N C E Higher sales from international, signaling and next generation on-board locomotive products, partially offset by lower sales in North America T R A N S I T Higher OE & aftermarket sales … Sales up 7.9% on constant currency basis 9 (1) During the first quarter of 2025, Management realigned businesses within the Freight Segment. Historical amounts have been reclassified to conform to the current period presentation.

1Q 2025 Consolidated Gross Profit ($ in millions) $ 8 2 1$ 8 1 52 0 2 4 G R O S S P R O F I T 32.9%32.7%% Gross Profit Margin ↑↑Volume ↑↑Mix/Pricing ↓↓Raw Materials ↓↓Currency ↑↑Manufacturing/Other $ 9 0 3$ 9 0 02 0 2 5 G R O S S P R O F I T 34.6%34.5%% Gross Profit Margin GAAP Adjusted Note: Adjusted numbers represent non-GAAP financial measures. See Appendix for additional details and reconciliations 1 Q K E Y D R I V E R S V O L U M E Higher Freight & Transit segment sales M I X / P R I C I N G Favorable mix of products within groups and modest contract escalation R A W M A T E R I A L S Unfavorable raw material C U R R E N C Y Unfavorable foreign exchange decreased adjusted gross profit $14M (adjusted operating income unfavorable by $9M) M A N U F A C T U R I N G / O T H E R Increased productivity and proactive cost controls 10

1Q 2025 Consolidated Operating Income O P M A R G I N B E N E F I T E D F R O M I N C R E A S E D G R O S S M A R G I N PA R T I A L LY O F F S E T BY S G & A 11 $495$4122 0 2 4 O P I N C O M E 19.8%16.5%% Operating Margin 8285Gross Profit (14)(26)SG&A 22Engineering -1Amortization $565$4742 0 2 4 O P I N C O M E 21.7%18.2%% Operating Margin Adjusted ($ in millions) GAAP Note: Adjusted numbers represent non-GAAP financial measures. See Appendix for additional details and reconciliations

12 1Q 2025 Freight Segment Performance SALES 4.2% INCREASE (5.6% INCREASE EX-CURRENCY) 2 0 2 4 2 0 2 5 2 0 2 4 GAAP 2 0 2 5 GAAP 2 0 2 4 ADJ(1) 2 0 2 5 ADJ(1) OP INCOME / OP MARGIN $1.90B(2) $1.82B $368M 20.2% 22.1% $439M 24.1% $488M 25.7%$420M 12-MONTH BACKLOG 7.1% INCREASE YOY (9.1% Excluding Currency) 0.3% DECREASE MULTI-YEAR BACKLOG(2) YOY(+1.4% Excl. Currency) 2 0 2 4 2 0 2 5 Note: Adjusted numbers represent non-GAAP financial measures. See Appendix for additional details and reconciliations (1) Freight segment operating income was positively impacted by below-market intangible amortization of $10 million; down $1 million versus 1st quarter 2024 (2) Foreign exchange negatively impacted Freight sales by $26 million; Foreign exchange rates had a negative $292 million impact on segment multi-year backlog $6.07B $5.67B

13 1Q 2025 Transit Segment Performance SALES 5.3% INCREASE (7.9% INCREASE EX-CURRENCY) 2 0 2 4 2 0 2 5 2 0 2 4 GAAP 2 0 2 5 GAAP 2 0 2 4 ADJ 2 0 2 5 ADJ OP INCOME / OP MARGIN $709M(1) $673M $74M 11.0% 12.7% $86M 12.7% $103M 14.6%$90M 12-MONTH BACKLOG 4.1% INCREASE YOY (2.2% Excluding Currency) 6.4% INCREASE MULTI-YEAR BACKLOG(1) YOY (+5.1% Excl. Currency) 2 0 2 4 2 0 2 5 $2.13B$2.04B Note: Adjusted numbers represent non-GAAP financial measures. See Appendix for additional details and reconciliations (1) Foreign exchange negatively impacted Transit sales by $17 million; Foreign exchange rates had a favorable $51 million impact on segment multi-year backlog

FOCUSED ON CASH CONVERSION( 1 ) CASH FROM OPS Resilient Business Allows For Execution On Financial Priorities ST RO NG FI N ANC IAL P ERFO RMANC E; I N VE ST ING FO R GROW TH AN D MA XI MIZ I NG S HA REHOLD ER R ET U RNS 14 Note: Adjusted numbers represent non-GAAP financial measures. See Appendix for additional details and reconciliations (1) Cash from Operations conversion % is defined as GAAP Cash from Operations divided by GAAP net income plus depreciation and amortization including deferred debt cost amortization (2) Leverage ratio is defined as net debt divided by trailing 12-month adjusted EBITDA (as defined in Wabtec’s credit agreements). Net debt is defined as total debt minus cash, restricted cash and cash equivalents (3) At March 31, 2025, the Company’s total available liquidity was $2.54 billion, which includes cash and cash equivalents of $0.69 billion, plus $1.50 billion available under current credit facilities and $0.35 billion borrowings available under our Revolving Receivables Program (4) The favorable impact from proceeds of accounts receivable securitization was $0 in the 1st quarter in 2025 and $210 million in the prior year period Strong balance sheet and financial position … liquidity of $2.54B DISCIPLINED CAPITAL ALLOCATION $191M Dividends Cash from Ops $98M First Quarter 2025 Capex Debt /Other$6M $44M Share repurchases 1st quarter cash from operations of $191M was down $143M due to higher accounts receivables 84% Cash Conv $334M $191M 1Q 2025 43% Cash Conv Debt leverage ratio of 1.5x (2) Returning capital to shareholders … $141M returned through dividends and share repurchases (1)(1) (4)(4) (3) 1Q 2024 $43M

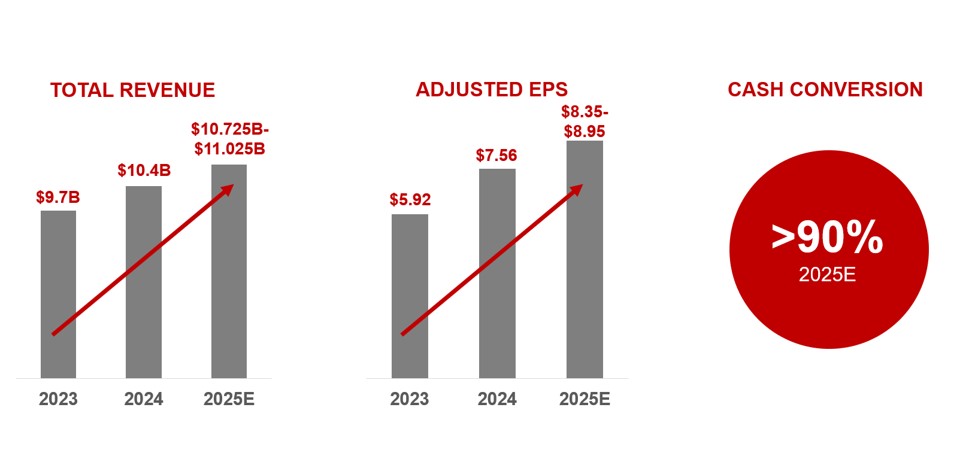
15 2025 Updated Financial Guidance (1,2) I N C R E A S E D A N D W I D E N E D A DJ U ST E D E P S R A N G E TO $ 8 . 3 5 - $ 8 . 9 5 (1) See Forward looking statements and non-GAAP financial information (2) Wabtec is not presenting a quantitative reconciliation of our forecasted GAAP earnings per diluted share to forecasted adjusted earnings per diluted share in reliance on the unreasonable efforts exemption provided under Item 10(e)(1)(i)(B) of Regulation S-K. Wabtec is unable to predict with reasonable certainty and without unreasonable effort the impact and timing of restructuring-related and other charges, including acquisition-related expenses and the outcome of certain regulatory, legal and tax matters. The financial impact of these items is uncertain and is dependent on various factors, including timing, and could be material to our Consolidated Statements of Earnings (3) Cash from operations conversion % is defined as GAAP cash from operations divided by GAAP net income plus depreciation and amortization including deferred debt cost amortization - Excludes Evident Inspection Technologies acquisition (expected end of Q2’25) - Assumes tariffs in effect with exception of reciprocal tariffs - Adjusted operating margin up - Favorable productivity/absorption - Benefits of Integration 2.0/Portfolio Optimization - Lower SG&A & Engineering expenses as % of sales - Tax rate ~24.5%; Capex ~2% of sales K E Y A S S U M P T I O N S : R E V E N U E S $10.725B to $11.0 25B A D J U S T E D D I L U T E D E P S $8.3 5 to $8.75 C A S H C O N V E R S I O N (3) >90% U P D A T E D G U I D A N C EP R I O R G U I D A N C E R E V E N U E S $10.7 25B to $11.0 25B A D J U S T E D D I L U T E D E P S $8.35 to $8.9 5 C A S H C O N V E R S I O N (3) >90%

16 Key Takeaways Continued momentum across the portfolio and strong order pipeline and backlog, internationally and in North America Positive productivity driven by continuous cost improvement combined with realization of Integration 2.0 & 3.0 savings Wabtec is well-positioned to drive higher returns and create top quartile long-term value for shareholders over time Strong revenue growth, margin expansion, increased earnings and improved cash flow 5-YEAR OUTLOOK(1) Mid Single Digit ORGANIC SALES CAGR Double Digit ADJUSTED EPS CAGR >90%(2) CASH FROM OPS CONVERSION 350+ bps ADJUSTED OPERATING MARGIN EXPANSION 1 2 3 4 (1) 5-Year outlook excludes Inspection Technologies acquisition (expected 1H2025); (2) Cash conversion to average >90% thru 2029

Income Statement 17 Appendix A (1 of 2) 2025 2024 Net sales 2,610$ 2,497$ Cost of sales (1,710) (1,682) Gross profit 900 815 Gross profit as a % of Net Sales 34.5% 32.7% Selling, general and administrative expenses (307) (281) Engineering expenses (46) (48) Amortization expense (73) (74) Total operating expenses (426) (403) Operating expenses as a % of Net Sales 16.3% 16.2% Income from operations 474 412 Income from operations as a % of Net Sales 18.2% 16.5% Interest expense, net (46) (47) Other expense, net (2) (2) Income before income taxes 426 363 Income tax expense (99) (86) Effective tax rate 23.2% 23.6% Net income 327 277 Less: Net income attributable to noncontrolling interest (5) (5) Net income attributable to Wabtec shareholders 322$ 272$ Earnings Per Common Share Basic Net income attributable to Wabtec shareholders 1.88$ 1.54$ Diluted Net income attributable to Wabtec shareholders 1.88$ 1.53$ Basic 170.5 176.5 Diluted 171.3 177.2 March 31, Three Months Ended WESTINGHOUSE AIR BRAKE TECHNOLOGIES CORPORATION CONDENSED CONSOLIDATED STATEMENTS OF INCOME FOR THE THREE MONTHS ENDED MARCH 31, 2025 AND 2024 (AMOUNTS IN MILLIONS EXCEPT PER SHARE DATA) (UNAUDITED)

Income Statement (cont.) 18 Appendix A (2 of 2) WESTINGHOUSE AIR BRAKE TECHNOLOGIES CORPORATION CONDENSED CONSOLIDATED STATEMENTS OF INCOME FOR THE THREE MONTHS ENDED MARCH 31, 2025 AND 2024 (AMOUNTS IN MILLIONS EXCEPT PER SHARE DATA) (UNAUDITED) 2025 2024 Segment Information Freight Net Sales 1,901$ 1,824$ Freight Income from Operations 420$ 368$ Freight Operating Margin 22.1% 20.2% Transit Net Sales 709$ 673$ Transit Income from Operations 90$ 74$ Transit Operating Margin 12.7% 11.0% Backlog Information (Note: 12-month is a sub-set of total) March 31, 2025 December 31, 2024 March 31, 2024 Freight Total 17,851$ 17,986$ 17,898$ Transit Total 4,451 4,286 4,185 Wabtec Total 22,302$ 22,272$ 22,083$ Freight 12-Month 6,069$ 5,577$ 5,667$ Transit 12-Month 2,127 2,104 2,043 Wabtec 12-Month 8,196$ 7,681$ 7,710$ March 31, Three Months Ended

Balance Sheet 19 Appendix B March 31, 2025 December 31, 2024 In millions Cash, cash equivalents and restricted cash 698$ 715$ Receivables, net 1,932 1,702 Inventories, net 2,378 2,314 Other current assets 247 212 Total current assets 5,255 4,943 Property, plant and equipment, net 1,462 1,447 Goodwill 8,787 8,710 Other intangible assets, net 2,892 2,934 Other noncurrent assets 700 668 Total assets 19,096$ 18,702$ Current liabilities 3,927$ 3,792$ Long-term debt 3,503 3,480 Long-term liabilities - other 1,252 1,297 Total liabilities 8,682 8,569 Shareholders' equity 10,368 10,091 Noncontrolling interest 46 42 Total shareholders' equity 10,414 10,133 Total Liabilities and Shareholders' Equity 19,096$ 18,702$ WESTINGHOUSE AIR BRAKE TECHNOLOGIES CORPORATION CONDENSED CONSOLIDATED BALANCE SHEETS (UNAUDITED)

Cash Flow 20 Appendix C 2025 2024 In millions Operating activities Net income 327$ 277$ Non-cash expense 127 126 Receivables (226) 121 Inventories (29) (85) Accounts Payable 13 45 Other assets and liabilities (21) (150) Net cash provided by operating activities 191 334 Net cash used for investing activities (44) (19) Net cash used for financing activities (172) (289) Effect of changes in currency exchange rates 8 (7) (Decrease) increase in cash (17) 19 Cash, cash equivalents and restricted cash, beginning of period 715 620 Cash, cash equivalents and restricted cash, end of period 698$ 639$ WESTINGHOUSE AIR BRAKE TECHNOLOGIES CORPORATION CONDENSED CONSOLIDATED STATEMENTS OF CASH FLOWS (UNAUDITED) Three Months Ended March 31,

EPS and Non-GAAP Reconciliation 21 Appendix D (1 of 2) Wabtec Corporation Reconciliation of Reported Results to Adjusted Results (in millions) Gross Operating Income from Interest & Noncontrolling Wabtec Net Sales Profit Expenses Operations Other Exp Tax Net Income Interest Net Income EPS Reported Results 2,610$ 900$ (426)$ 474$ (48)$ (99)$ 327$ (5)$ 322$ 1.88$ Restructuring and Portfolio Optimization costs - 3 6 9 - (2) 7 - 7 0.04$ Transaction costs - - 10 10 - (2) 8 - 8 0.04$ Non-cash Amortization expense - - 72 72 - (17) 55 - 55 0.32$ Adjusted Results 2,610$ 903$ (338)$ 565$ (48)$ (120)$ 397$ (5)$ 392$ 2.28$ Fully Diluted Shares Outstanding 171.3 Wabtec Corporation Reconciliation of Reported Results to Adjusted Results (in millions) Gross Operating Income from Interest & Noncontrolling Wabtec Net Sales Profit Expenses Operations Other Exp Tax Net Income Interest Net Income EPS Reported Results 2,497$ 815$ (403)$ 412$ (49)$ (86)$ 277$ (5)$ 272$ 1.53$ Restructuring and Portfolio Optimization costs - 6 4 10 - (2) 8 - 8 0.05$ Non-cash Amortization expense - - 73 73 - (17) 56 - 56 0.31$ Adjusted Results 2,497$ 821$ (326)$ 495$ (49)$ (105)$ 341$ (5)$ 336$ 1.89$ Fully Diluted Shares Outstanding 177.2 First Quarter Year-to-Date 2024 Actual Results Set forth below is the calculation of the non-GAAP performance measures included in this press release. We believe that these measures provide useful supplemental information to assess our operating performance and to evaluate period-to-period comparisons. Non-GAAP financial measures should be viewed in addition to, and not as an alternative for, Wabtec's reported results prepared in accordance with GAAP. First Quarter Year-to-Date 2025 Actual Results

EPS and Non-GAAP Reconciliation 22 Appendix D (2 of 2) Set forth below is the calculation of the non-GAAP performance measures included in this press release. We believe that these measures provide useful supplemental information to assess our operating performance and to evaluate period- to-period comparisons. Non-GAAP financial measures should be viewed in addition to, and not as an alternative for, Wabtec's reported results prepared in accordance with GAAP. Wabtec Corporation Reconciliation of Reported Results to Adjusted Results (in millions) Gross Operating Income from Interest & Noncontrolling Wabtec Net Sales Profit Expenses Operations Other Exp Tax Net Income Interest Net Income EPS Reported Results 10,387$ 3,366$ (1,757)$ 1,609$ (199)$ (343)$ 1,067$ (11)$ 1,056$ 6.04$ Restructuring and Portfolio Optimization costs - 37 33 70 (4) (16) 50 - 50 0.28$ Non-cash Amortization expense - - 288 288 - (70) 218 - 218 1.24$ Adjusted Results 10,387$ 3,403$ (1,436)$ 1,967$ (203)$ (429)$ 1,335$ (11)$ 1,324$ 7.56$ Fully Diluted Shares Outstanding 174.8 Fourth Quarter Year-to-Date 2024 Actual Results Wabtec Corporation Reconciliation of Reported Results to Adjusted Results (in millions) Gross Operating Income from Interest & Noncontrolling Wabtec Net Sales Profit Expenses Operations Other Exp Tax Net Income Interest Net Income EPS Reported Results 9,677$ 2,944$ (1,678)$ 1,266$ (174)$ (267)$ 825$ (10)$ 815$ 4.53$ Restructuring and Portfolio Optimization costs - 38 41 79 - (17) 62 - 62 0.34$ Gain on LKZ Investment - - - - (35) - (35) - (35) (0.19)$ Non-cash Amortization expense - - 298 298 - (74) 224 - 224 1.24$ Adjusted Results 9,677$ 2,982$ (1,339)$ 1,643$ (209)$ (358)$ 1,076$ (10)$ 1,066$ 5.92$ Fully Diluted Shares Outstanding 179.5 Fourth Quarter Year-to-Date 2023 Actual Results

EBITDA Reconciliation 23 Appendix E Wabtec Corporation 2025 Q1 YTD EBITDA Reconciliation (in millions) Reported Income Other Income Depreciation & Restructuring & Adjusted from Operations (Expense) Amortization Transaction Costs EBITDA Consolidated Results $474 ($2) $119 $591 $17 $608 Wabtec Corporation 2024 Q1 YTD EBITDA Reconciliation (in millions) Reported Income Other Income Depreciation & Restructuring Adjusted from Operations (Expense) Amortization Costs EBITDA Consolidated Results $412 ($2) $122 $532 $8 $540 Set forth below is the calculation of the non-GAAP performance measures included in this press release. We believe that these measures provide useful supplemental information to assess our operating performance and to evaluate period-to-period comparisons. Non-GAAP financial measures should be viewed in addition to, and not as an alternative for, Wabtec's reported results prepared in accordance with GAAP. + + = EBITDA + = =+ + = EBITDA +

Sales by Product Line 24 Appendix F In millions 2025 2024 Freight Segment Equipment 476$ 526$ Components 381 384 Digital Intelligence 181 176 Services 863 738 Total Freight Segment 1,901$ 1,824$ Transit Segment Original Equipment Manufacturer 322$ 310$ Aftermarket 387 363 Total Transit Segment 709$ 673$ Three Months Ended March 31, WESTINGHOUSE AIR BRAKE TECHNOLOGIES CORPORATION SALES BY PRODUCT LINE (UNAUDITED)

Segment Gross Margin & Operating Margin Reconciliation 25 Appendix G In mill ions Gross Profit Income from Operations Gross Profit Income from Operations Freight Segment Reported Results 685$ 420$ 625$ 368$ Freight Segment Reported Margin 36.0% 22.1% 34.3% 20.2% Restructuring and Portfolio Optimization costs 2 3 3 3 Non-cash Amortization expense - 65 - 68 Freight Segment Adjusted Results 687$ 488$ 628$ 439$ Freight Segment Adjusted Margin 36.2% 25.7% 34.5% 24.1% Transit Segment Reported Results 215$ 90$ 190$ 74$ Transit Segment Reported Margin 30.3% 12.7% 28.2% 11.0% Restructuring and Portfolio Optimization costs 1 6 3 7 Non-cash Amortization expense - 7 - 5 Transit Segment Adjusted Results 216$ 103$ 193$ 86$ Transit Segment Adjusted Margin 30.4% 14.6% 28.6% 12.7% WESTINGHOUSE AIR BRAKE TECHNOLOGIES CORPORATION RECONCILIATION OF REPORTED RESULTS TO ADJUSTED RESULTS - BY SEGMENT (UNAUDITED) Three Months Ended March 31, 2025 2024

Segment Sales Reconciliation 26 Appendix H In millions Freight Transit Consolidated 2024 Net Sales 1,824$ 673$ 2,497$ Acquisitions 15 8 23 Foreign Exchange (26) (17) (43) Organic 88 45 133 2025 Net Sales 1,901$ 709$ 2,610$ Change ($) 77 36 113 Change (%) 4.2% 5.3% 4.5% Three Months Ended March 31, WESTINGHOUSE AIR BRAKE TECHNOLOGIES CORPORATION RECONCILIATION OF CHANGES IN NET SALES - BY SEGMENT (UNAUDITED)

Cash Conversion Reconciliation 27 Appendix I Wabtec Corporation 2025 Q1 YTD Cash Conversion Calculation (in millions) Reported Cash from Operations Consolidated Results $191 $327 $120 43% Wabtec Corporation 2024 Q1 YTD Cash Conversion Calculation (in millions) Reported Cash from Operations Consolidated Results $334 $277 $123 84% Cash Conversion Set forth below is the calculation of the non-GAAP performance measures included in this press release. We believe that these measures provide useful supplemental information to assess our operating performance and to evaluate period-to-period comparisons. Non-GAAP financial measures should be viewed in addition to, and not as an alternative for, Wabtec's reported results prepared in accordance with GAAP. ÷ (Net Income + Depreciation & Amortization) = Cash Conversion÷ (Net Income + Depreciation & Amortization) =